Data dive: A look at IU’s second half struggles

Editor’s note: Only conference games were considered in this analysis.
One of the topics covered earlier this year was Indiana’s propensity for close games and their struggles to win those games. Not only has Indiana played in a lot of tight games this year, it’s actually held a lead in many of them. In fact, only Wisconsin (14) and Iowa (13) have held more halftime leads than Indiana (10) in the entire conference.
Indiana didn’t hold a halftime lead in any of its first five Big Ten games, which means that IU has been the halftime leader in 10 out of their final 13 conference games. The caveat, however, is that the Hoosiers have struggled to hold onto the lead in those contests.
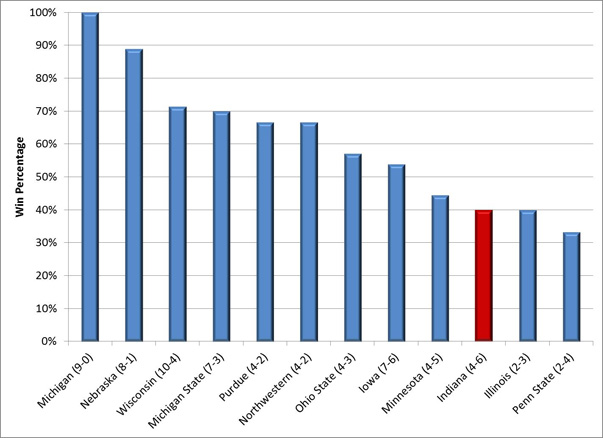
The chart below shows each Big Ten team’s winning percentage in the games it was leading at halftime:

At 4-6, Indiana is just tenth in the conference in terms of closing out games when they lead at the half. The Hoosiers have led by an average of seven points in the games they have lost, the highest mark in the conference. The second half certainly seems to cause this Hoosier team difficulty, but by looking at the play-by-play data the issue can be better understood.
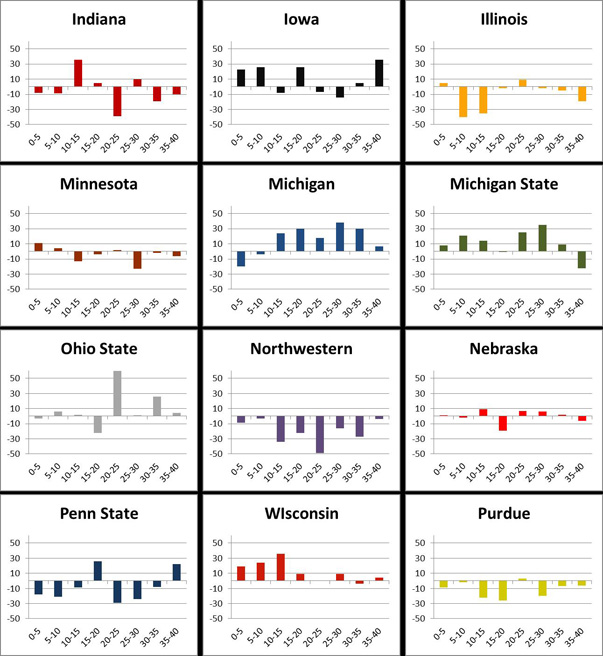
First, here is a look at the scoring differential for each Big Ten team in five minute chunks of game time. The graphic is a bit overwhelming, but including all of the conference teams provides a fascinating overview. (Horizontal axis in minutes, vertical axis in points).

A couple of interesting notes on teams other than Indiana:
· Ohio State is clobbering their opponents in the five minutes after halftime.
· Wisconsin dominates the first half and then seems to merely hang on for victory in the second half.
· Michigan is a slow starter, losing in the first ten minutes, but blowing by their opponents after that.
· Nebraska is the most consistent team with no single stretch of time much better or worse than the others.
It is also important to take these numbers with a bit of caution as they are likely prone to large game-to-game variation.
Moving on to IU, the Hoosiers are very strong midway through the first half, but the point that really jumps out is the five minutes directly after halftime. Indiana is second worst in the league during this stretch, behind only Northwestern. This aligns with what most people would observe watching IU’s Big Ten games: They play well to build a lead at the half but have often let the lead slip away quickly after halftime.
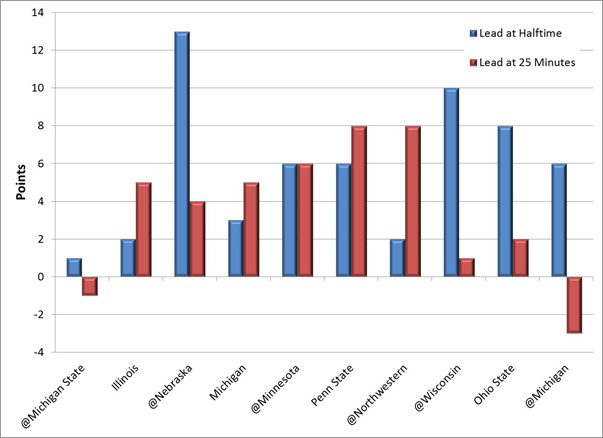
The figure below shows Indiana’s halftime leads and the subsequent lead five minutes after halftime.

At Nebraska, at Wisconsin, vs. Ohio State, and at Michigan all stand out as particularly rough stretches. Of these four Indiana only won the Ohio State game and missed out on road wins in the other three.
What’s more interesting than verifying that this does happen is to understand why it is happening. Is it the offense, defense, or a combination of both?
Looking at the points per possession statistics answers this question quite clearly: Indiana is scoring 1.01 points per possession and allowing 1.35 points per possession for the five minutes directly after halftime. On the season, Indiana scores right at 1.00 points per possession in conference play, but allows only 1.03 points per possession. In other words, Indiana’s offense performs the same but its defense is much worse during this time period.
Even using play-by-play data, defense is difficult to measure, so determining what exactly is allowing Indiana’s opponents to score at a higher clip is challenging. Still, there are some statistics that stand out: turnovers forced per possession, second chance points allowed and 3-point field goal percentage allowed.
In the first five minutes after halftime Indiana allows its opponents to score about 13 second chance points per 40 minutes while it allows only nine second chance points per 40 minutes overall.
Additionally, IU forces turnovers on just 12 percent of its opponent’s possessions in the five minutes following halftime but on the Big Ten season overall the team sports a turnover rate of 17 percent.
Finally, Indiana is allowing its opponents to score more 3-point field goals and to shoot a higher percentage on them after halftime. In the five minutes after intermission, Indiana is allowing its opponents to shoot 45 percent on 3-point field goals while they allow just 31 percent on 3-pointers overall in Big Ten play, the best in the conference.

Though this young team is still learning how to work together for a full 40 minutes, they have shown they can make improvements, even mid-season. The regular season is now behind the Hoosiers, but as senior Will Sheehey will tell you, there are still more games to be played. The upcoming Big Ten tournament may just reveal how Indiana can put their struggles behind them and build on their recent improvement.
Filed to: Statistics
